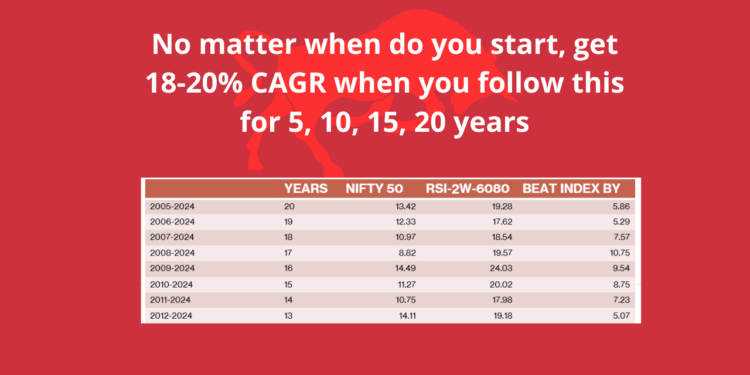
In this article, I am going to discuss about a very good investing strategy that gave consistent CAGR values when back tested among different time periods of 5, 10, 15 and 20 years.
Strategy Name: RSI-2W-6080
List of stocks:
ADANIPORTS
APOLLOHOSP
ASIANPAINT
AXISBANK
BAJAJ-AUTO
BAJAJFINSV
BAJFINANCE
BHARTIARTL
BRITANNIA
CIPLA
DRREDDY
EICHERMOT
GRASIM
HCLTECH
HDFCBANK
HDFCLIFE
HEROMOTOCO
HINDALCO
HINDUNILVR
ICICIBANK
INDUSINDBK
INFY
ITC
JSWSTEEL
KOTAKBANK
LT
M&M
MARUTI
NESTLEIND
RELIANCE
SHRIRAMFIN
SUNPHARMA
TATACONSUM
TATAMOTORS
TATASTEEL
TCS
TECHM
TITAN
TRENT
ULTRACEMCO
WIPRO
The strategy has been back tested only on the above 41 stocks. All these are quality stocks hence we can expect more or less same performance of the strategy from these list of stocks in future years as well similar to back test results.
Strategy Rules:
- Timeframe: Weekly
-
Indicators: 2 Period RSI
-
Filter the stocks that satisfies the below 2 conditions.
- Current week and previous week candle should be green
- Current week RSI > 60 & RSI < 80
-
Sort all the filtered stocks in descending order of RSI value
-
Buy the top stocks (subject to max 10 stocks in your portfolio) at the close of the current week (3.15 to 3.30 PM on Friday).
- Stoploss: Min value of current week low and previous week low
-
Make sure to have minimum stoploss as 2% from the entry if weekly candles are very small. Also make sure to have maximum stoploss as 8% if weekly candles are very big.
-
Trailing Stoploss: No.
- Target: 10 times of stoploss
-
Make sure at any point of time only 10 active trades are present in your portfolio.
Capital Allocation & Risk:
- Assume Total capital: 10,00,000 (10 Lakhs)
- Maximum active trades at any point: 10
- Capital allocation for each stock: 10,00,000 / 10 = 1,00,000
- Max risk per trade: Since we have max 8% stoploss on a single trade the max risk would be 8% on 1,00,000 which is 8,000 subject to the fact no gap down open happen below your stoploss
- Max reward per trade: Since we have target as 10 times of stoploss, the max reward could be 10 times of max stoploss which is 8% * 10 = 80% on a single trade i.e. 80,000 on 1,00,000
Back test Results:
The back test has been performed on various time periods of min 1 year to max 20 years. such as 2005-2024, 2006-2024, 2007-2024….. 2024-2024 etc. So that the strategy can give a clear picture how it is performing when we have different start times and different time periods to decide to use it in live scenario or not.
CAGR:
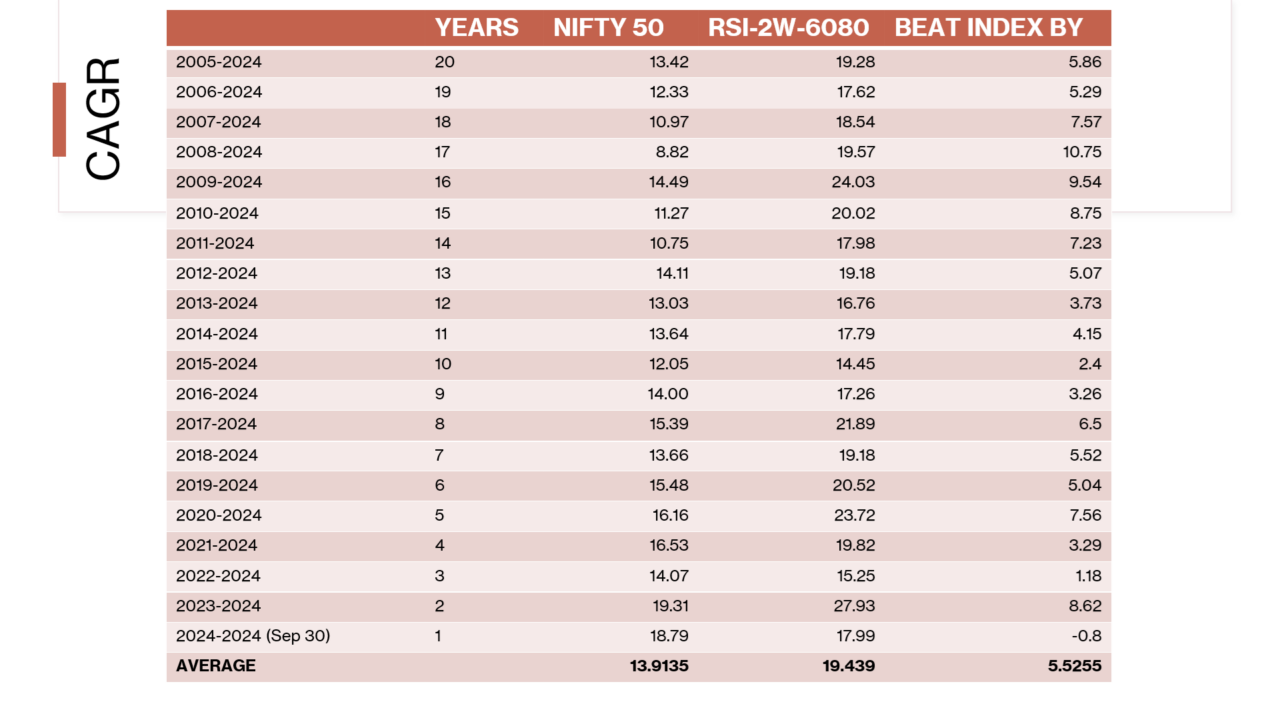
The below table shows the CAGR values of Nifty 50 benchmark index and strategy RSI-2W-6080 and it also shows how the strategy has beaten in the index in the last column.

The last row shows the average value of each column. On an average, this strategy beating index by 5.5% across different time periods.
Max Drawdown:
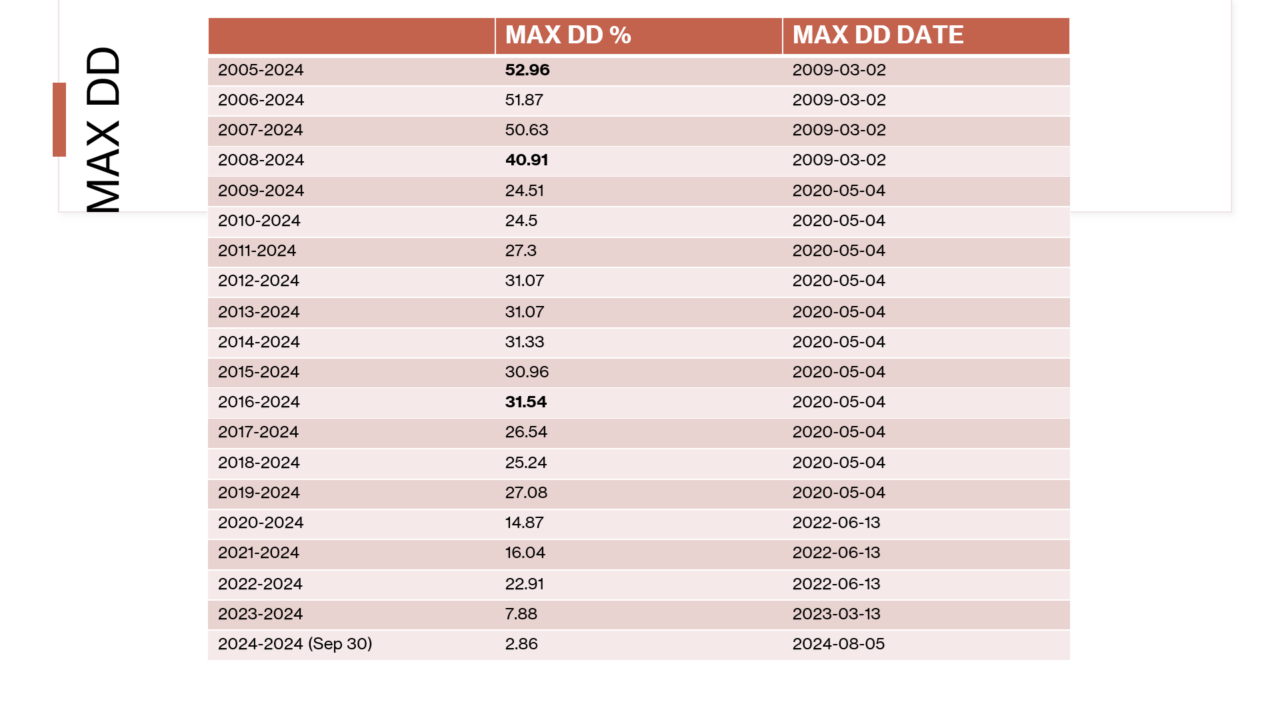
The below table shows the max drawdowns of this strategy across different time periods. It also shows when that max drawdown occurred in the last column (MAX DD DATE).

The max drawdown in this strategy was around 50% when started this strategy in 2005, 2006 or 2007 and the max drawdown hit during 2008 financial crisis when the market made bottom in March 2009. Surprisingly if we would have started this strategy at the peak of 2004-2008 bull run, we would have seen the max DD of 40% after the market made the bottom in March 2009. The 2nd highest drawdown was around 30% that got hit during 2020 Corona crash.
Dividend Reinvestment:
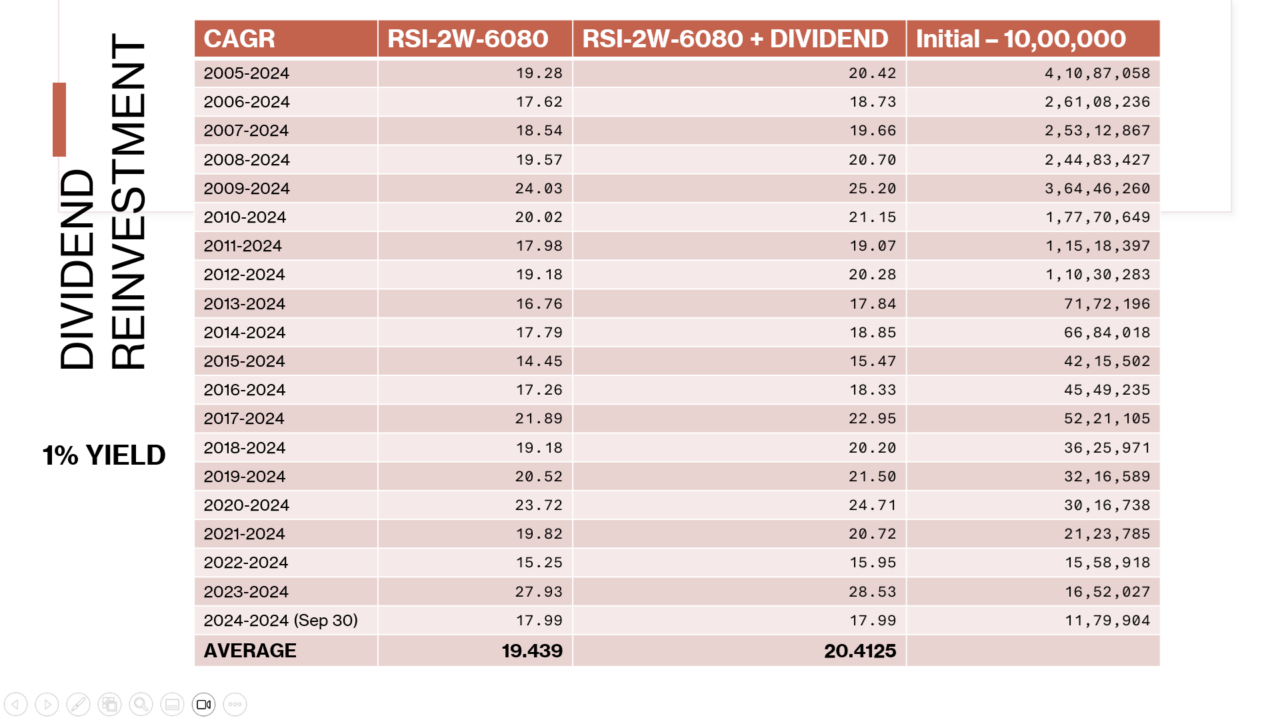
Let us see how the returns look like if we reinvest the dividends into this strategy. Here I am assuming the total dividend yield of just 1% for each year and reinvesting the whole dividend we received in the year at the end of the year i.e. at the start of next year so the dividend investment will participate in the compounding part.

In summary, when we reinvest dividends, on an average the strategy gave around 20% CAGR across different time periods. The last column in the above table shows the final value at the final year against the time period assuming the starting capital of 10,00,000 at the start year of the time period. For example, the strategy turned 10 Lakh initial investment value into 2.44 crores from the period 2008-Jan-01 to 2024-Sep-30.
Compounding & Rebalancing:
Please refer to the article Compounding & Rebalancing method to understand how to compound and rebalance the portfolio while executing this strategy in real life.
I am providing you the complete back test report in the form of downloadable excel file at the bottom of the post.
The back test report contains following sheets:
- Trades: All trades with entry, exit, start and end timestamps, pnl, charges, net pnl etc.
- Symbol wise Pnl
- Date wise Pnl
- Date & Symbol wise Pnl
- Month wise Pnl
- Month & Symbol wise Pnl
- Year wise Pnl
- Year & Symbol wise Pnl
- Win Loss Ratio of each stock
- Summary report with important data.
I hope this would be helpful for you guys to do some further analysis.
Download Back test Reports:
In this article, I am providing the complete back test report for the period 2008-2024.
BackTest_SWING-STOCKS-RSI-2W-6080_2008-01-01_to_2024-09-30.xls


