In this article, I am going to discuss about ORB intraday strategy and presenting the back tested results of the same over few years. Though this article focuses on Indian stock market, the strategy rules can also be applied to other markets across the world.
Opening Range Breakout (ORB) strategy is a well known intraday strategy. The first few minutes trading range after market open is called “opening range”. Typically first 15 minute candle is considered for opening range breakout strategy. Some traders may trade on first 30 min candle or first 1 hour candle depending on their own set of rules.
In this article, we are considering first 15 minute for ORB strategy. Please find the rules of the strategy below.
Strategy Rules:
Wait for first 15 minutes after market opens and mark the high and low of the first 15 minute candle.
Long Trade:
- Take long trade when the price of the instrument breaks out the high of the candle
- Stoploss: Low of the candle
- Target: Consider 1:2 risk reward ratio i.e. target points would be double of SL points
- Square off: If no SL or target hits then exit the trade 15 minutes before the market closes i.e. 3:15 PM.
Short Trade:
- Take short trade when the price of the instrument breaks down the low of the candle
- Stoploss: High of the candle
- Target: Consider 1:2 risk reward ratio i.e. target points would be double of SL points
- Square off: If no SL or target hits then exit the trade 15 minutes before the market closes i.e. 3:15 PM.
Stock Selection: All F&O stocks. We are going to run back test on all futures and options stocks. There are around 180 stocks in futures & options segment of NSE.
Capital: We are going to allocate 1 Lakh (1,00,000) capital for each stock and we risk only 1% of 1 Lakh on each trade i.e. the risk on each trade is 1,000.
Back test Period: 01-01-2022 To 24-10-2024 (Approx. 3 years)
Charges: All charges like brokerage, STT, exchange transactions are considered while running back test.
Slippages: This back test does not account any slippages that we encounter in live trading.
Please note we don`t take another trade in the same stock after first trade SL hits.
To keep the back test simple, buffer (delta) value is not considered in this back test. Buffer is some extra value that we consider just above or below the breakout line.
Back test results:
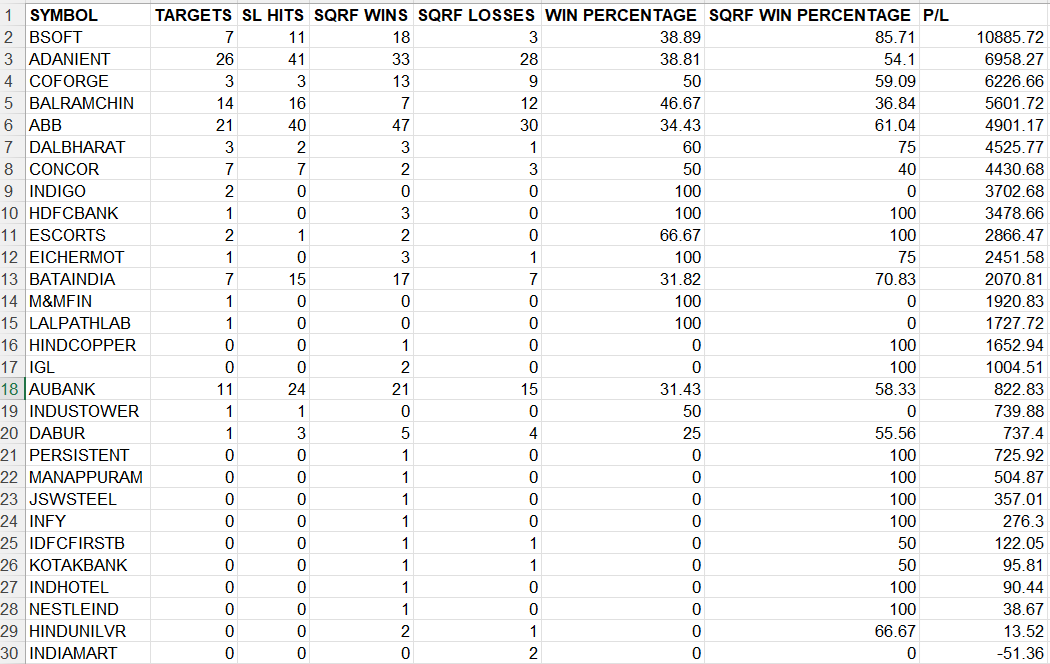
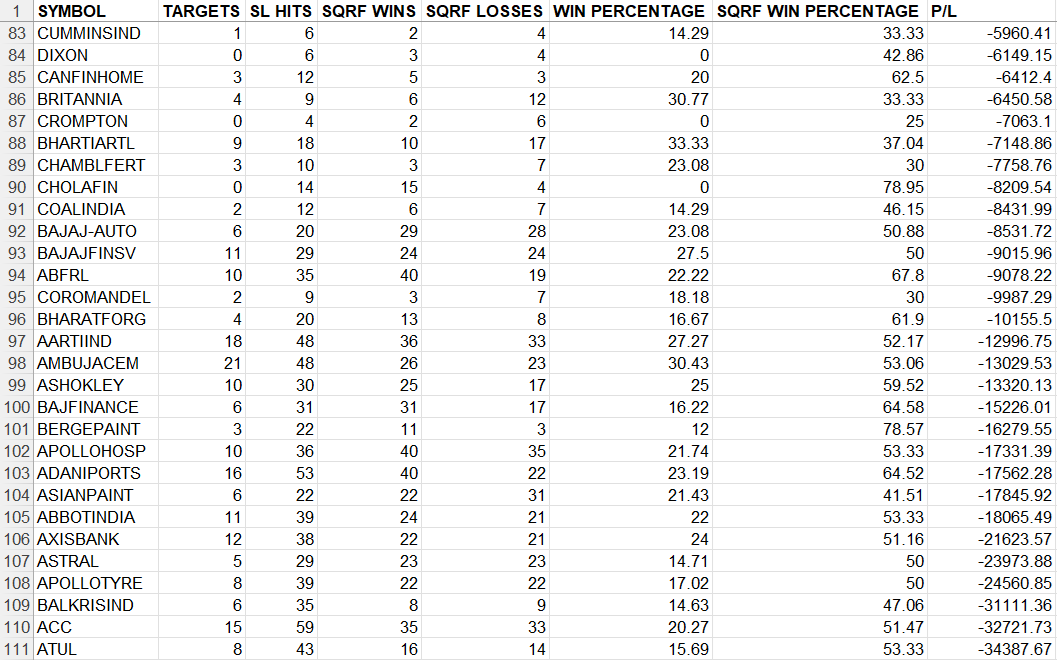
Out of 180 stocks there are only few stocks (30) ended in profit. Attaching some screenshots of stocks resulted into max profit and max loss.
In summary this strategy is loss making if you look at the results. This plain ORB strategy gives profit in some stocks during certain period. Predicting such a period and trading in those stocks can turn into profitable system. But this is near to impossible. But with some tweaks like selecting few stocks on a particular day based on some criteria (with indicators or price action on higher timeframe) and applying this strategy only to those stocks on that day may improve the outcome.
I am providing you the complete back test report in the form of downloadable excel file at the bottom of the post.
The back test report contains following sheets:
- Trades: All trades with entry, exit, start and end timestamps, pnl, charges, net pnl etc.
- Symbol wise Pnl
- Date wise Pnl
- Date & Symbol wise Pnl
- Month wise Pnl
- Month & Symbol wise Pnl
- Year wise Pnl
- Year & Symbol wise Pnl
- Win Loss Ratio of each stock
- Summary report with important data.
I hope this would be helpful for you guys to do some further analysis.
Download Back test Report:
BackTest_ORB_V1_2022-01-01_to_2024-10-24-All-Fno-Stocks.xls


