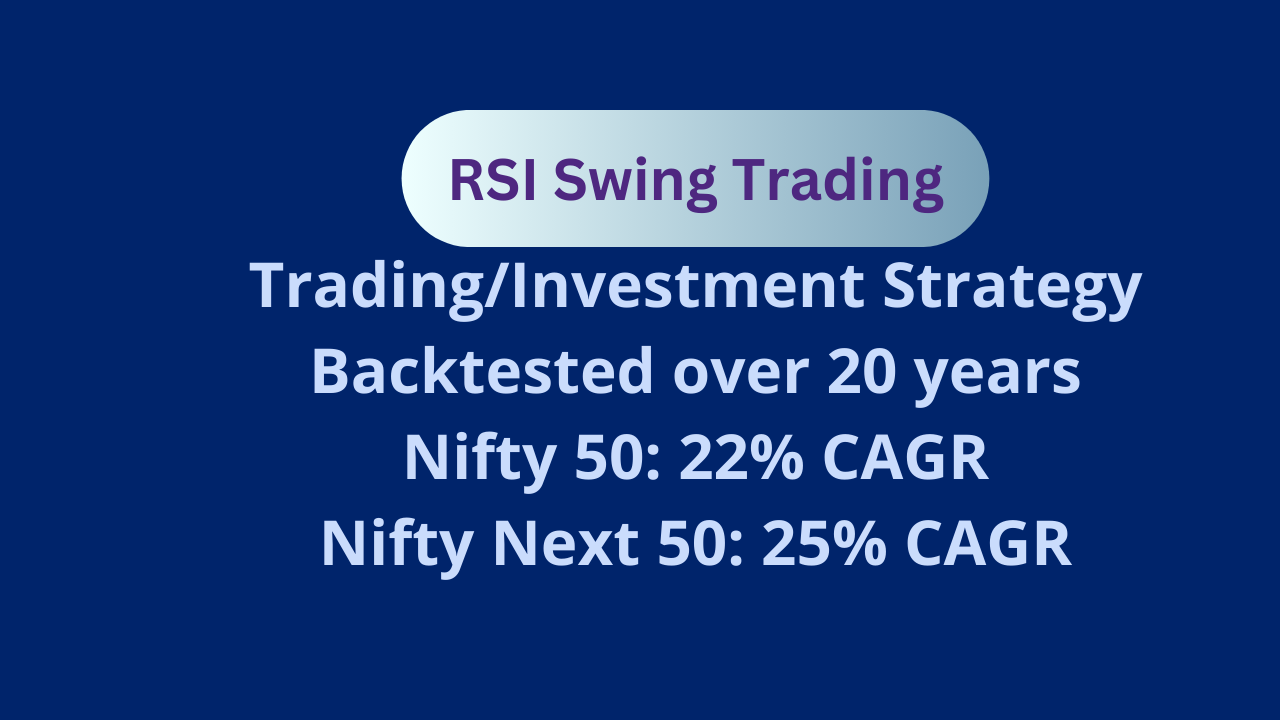
In this article, I am going to back test a swing trading/investment strategy based on simple RSI indicator on weekly time frame.
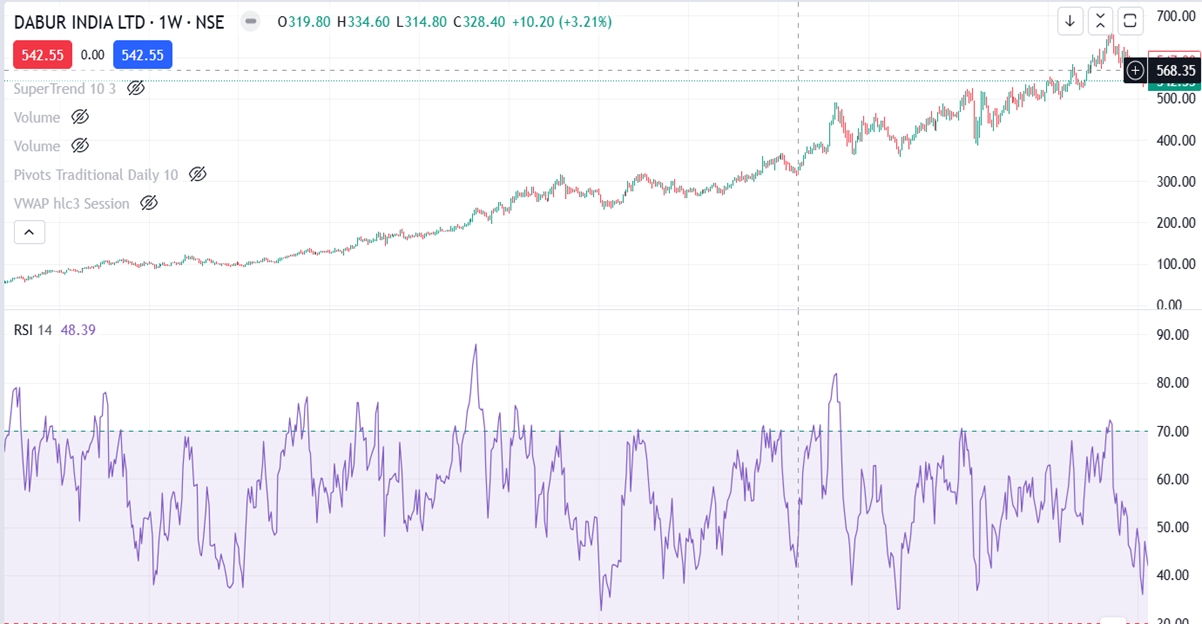
What is RSI ?
- Relative Strength Index (RSI) is a momentum indicator.
- This indicator oscillates between 0 and 100.
- Below is sample chart with RSI indicator.
In this strategy we are going to consider the stocks list as on today`s Nifty 50/Nifty Next 50 constituents which are provided below. If you are planning to use this strategy then please follow the same list for the upcoming years instead of future Nifty 50/Nifty Next 50 stocks.
Nifty 50 stocks: (As on Oct 2024)
ADANIENT
ADANIPORTS
APOLLOHOSP
ASIANPAINT
AXISBANK
BAJAJ-AUTO
BAJFINANCE
BAJAJFINSV
BEL
BPCL
BHARTIARTL
BRITANNIA
CIPLA
COALINDIA
DRREDDY
EICHERMOT
GRASIM
HCLTECH
HDFCBANK
HDFCLIFE
HEROMOTOCO
HINDALCO
HINDUNILVR
ICICIBANK
ITC
INDUSINDBK
INFY
JSWSTEEL
KOTAKBANK
LT
M&M
MARUTI
NTPC
NESTLEIND
ONGC
POWERGRID
RELIANCE
SBILIFE
SHRIRAMFIN
SBIN
SUNPHARMA
TCS
TATACONSUM
TATAMOTORS
TATASTEEL
TECHM
TITAN
TRENT
ULTRACEMCO
WIPRO
Nifty Next 50 stocks: (As on Oct 2024)
ABB
ADANIENSOL
ADANIGREEN
ADANIPOWER
ATGL
AMBUJACEM
DMART
BAJAJHLDNG
BANKBARODA
BHEL
BOSCHLTD
CANBK
CHOLAFIN
DLF
DABUR
DIVISLAB
GAIL
GODREJCP
HAVELLS
HAL
ICICIGI
ICICIPRULI
IOC
IRCTC
IRFC
NAUKRI
INDIGO
JSWENERGY
JINDALSTEL
JIOFIN
LTIM
LICI
LODHA
NHPC
PIDILITIND
PFC
PNB
RECLTD
MOTHERSON
SHREECEM
SIEMENS
TVSMOTOR
TATAPOWER
TORNTPHARM
UNIONBANK
UNITDSPR
VBL
VEDL
ZOMATO
ZYDUSLIFE
Strategy Rules:
- Timeframe: Weekly
- Indicators: Only RSI
- Filter the stocks that satisfies below 2 conditions
- Current week candle and previous week candle should be in green
- Current week RSI > 60
- Sort all the filtered stocks in descending order of RSI value
- Buy the filtered stocks at the close of the current week.
- Stoploss: Min value of current week low and previous week low.
- Make sure to have minimum stoploss as 2% from the entry if weekly candles are very small. Also make sure to have maximum stoploss as 8% if weekly candles are very big.
- Trailing Stoploss: No.
- Target: 10 times of stoploss.
- Make sure at any point of time only 10 active trades are present in your portfolio.
Capital Allocation & Risk:
- Assume Total capital: 10,00,000 (10 Lakhs)
- Maximum active trades at any point: 10
- Capital allocation for each stock: 10,00,000 / 10 = 1,00,000
- Max risk per trade: Since we have max 8% stoploss on a single trade the max risk would be 8% on 1,00,000 which is 8,000 subject to the fact no gap down open happen below your stoploss.
- Max reward per trade: Since we have target as 10 times of stoploss, the max reward could be 10 times of max stoploss which is 8% * 10 = 80% on a single trade i.e. 80,000 on 1,00,000
Challenges & Assumptions while back testing:
- There are scenarios where a stock can gap down open below the stoploss point and not possible to exit at the predefined stoploss. In this case I am assuming we exit the stock at 1% below the open price of the day that generally causes more loss than the predefined loss. Good news is I have handled this my back test.
- The back test assumes the Nifty 50 stocks as on today`s list. The same list is not true when you go back few years in past. The ideal back test should consider the Nifty 50 stocks during the same period when trades are taken in the past.
How can I follow this strategy?
- You need to spend around 15-30 minutes every week just before the close of the market for that week.
- If you are already having 10 active trades in your portfolio and no trade hits stoploss or target at the end of current week, you don’t need to do any work.
- If you have less than 10 active trades, then manually filter out the stocks as per the strategy rules mentioned above by looking at the weekly charts of all Nifty 50 stocks. This is a simple task and can be done in 15-30 minutes.
- In many cases you just need to initiate 2-3 trades in a week and sometimes no trades at all.
- After entering a trade, you need to keep stoploss or target every day but nowadays many brokers are providing GTT order facility which has many days validity period. So, you can just enter your GTT stoploss or target order after initiating the trade.
Be disciplined & Don’t apply your brain:
- Please note that this is not a get rich quick strategy. There are times you don’t see any returns for almost 2 years still you need to follow it rigorously.
- Understand all risk factors, max drawdown, unexpected future surprises etc.
- If you really want to follow this strategy, then be disciplined and exit your trade at predefined stoploss and target points. Don’t wait for the stock to recover when your stoploss hits, instead blindly exit at loss.
- Don’t wait for the stock to give more gains when your target hits, just blindly book the profits at the target.
- Don`t regret if a trade goes to 40% profit and comes back and exits at 8% loss. This is part of the game. Instead feel proud for not breaking the rules.
- Most importantly don’t apply your logic like exiting partial quantity at some small profits etc. This kind of behavior just gives temporary satisfaction in the short term, and you may feel that you are smarter than the system, but it will ruin the overall strategy in the longer run, and you may end up getting just less or half the returns of actual returns as per the strategy rules.
Back test Results:
Back test Period: 2005-2024 (20 years)
Nifty 50:
CAGR: 22%
Max Drawdown: 25%
Nifty Next 50:
CAGR: 25%
Max Drawdown: 25%
I am providing you the complete back test report in the form of downloadable excel file at the bottom of the post.
The back test report contains following sheets:
- Trades: All trades with entry, exit, start and end timestamps, pnl, charges, net pnl etc.
- Symbol wise Pnl
- Date wise Pnl
- Date & Symbol wise Pnl
- Month wise Pnl
- Month & Symbol wise Pnl
- Year wise Pnl
- Year & Symbol wise Pnl
- Win Loss Ratio of each stock
- Summary report with important data.
I hope this would be helpful for you guys to do some further analysis.
Download Back test Reports:
Nifty 50: BackTest_SWING-STOCKS-WEEKLY_V1_2005-01-01_to_2024-10-24_Nifty-50.xls
Nifty Next 50: BackTest_SWING-STOCKS-WEEKLY_V1_2005-01-01_to_2024-10-24_Nifty-Next-50.xls


