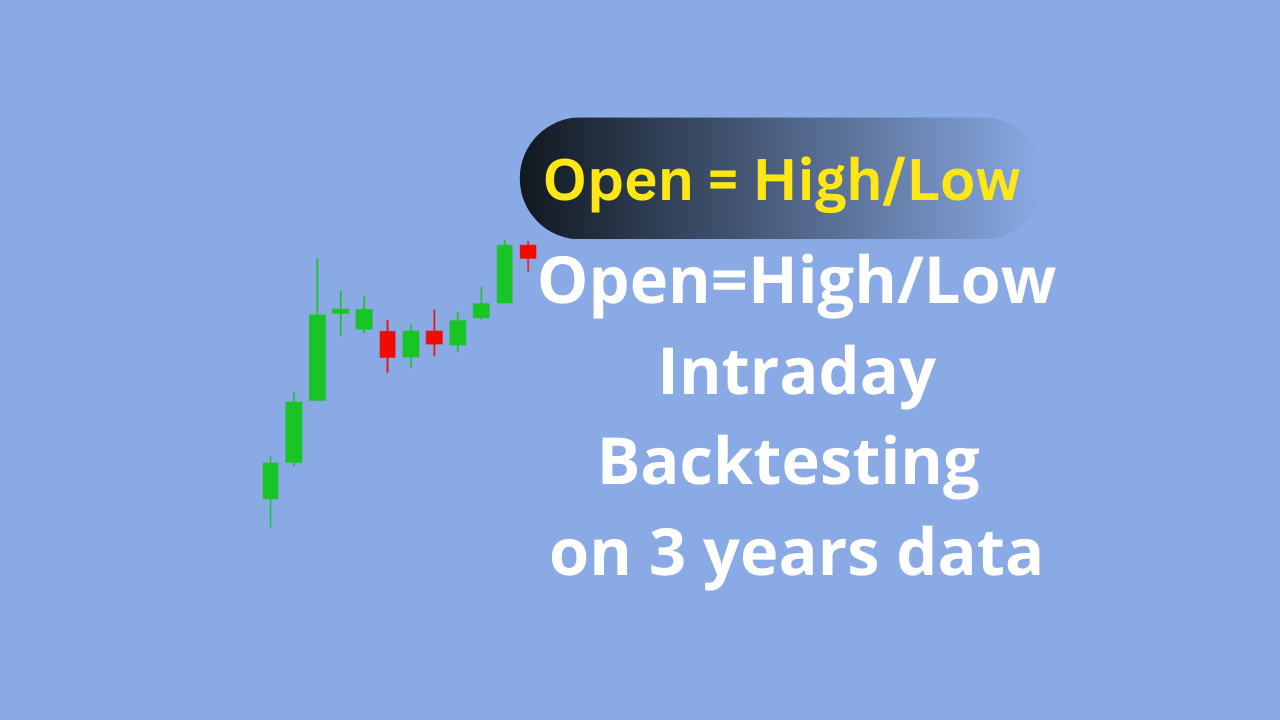
In this article, I am going to discuss about a well known intraday strategy based on open=high or open=low price action. I will be providing the back tested results of the same over few years. Though this article focuses on Indian stock market, the strategy rules can also be applied to other markets across the world.
What is Open = Low/High?
As soon as market opens if any stock keep moving in one direction for some time without breaking the opening price of the day.
- If a stock keep moving upwards after market opens without looking back then open = low scenario can occur.
- If a stock keep moving downwards after market opens without looking back then open = high scenario can occur.
The open = high or open = low scenario can be valid for 15 minutes, 1 hour or few hours or for the entire day. Only few scenarios will result into open = low or open = high till the end of the day. Many times the price reverses and breaks the open of the day.
Strategy Rules:
We need to decide on some time period after which we will filter out the stocks that satisfies the open = low or open = high condition.
In this strategy, we will wait for first 15 minutes after market opens.
Stock Selection: Nifty 50 stocks. After first 15 minutes, we list out all the stocks from Nifty 50 that satisfies either open = low condition or open = high condition. The stocks that satisfies the open = low condition will be considered for Long trades and the stocks that satisfies the open = high condition will be considered for Short trades.
Identify the breakout levels: Since this is a breakout strategy we need to identify the breakout levels after filtering the stocks at 09:30 AM. Consider the high so far (i.e. in the first 15 minutes) of a stock as a long breakout level subject to the condition open = low. Similarly consider the low so far of a stock as a short breakout level subject to the condition open = high.
Note: We will not take a trade if any filtered stock breaks open price before breaking the breakout levels.
Long Trade:
- Take long trade when the price of the instrument breaks out the long breakout level.
- Stoploss: Open of the day
- Target: Consider 1:2 risk reward ratio i.e. target points would be double of SL points
- Square off: If no SL or target hits then exit the trade 15 minutes before the market closes i.e. 3:15 PM.
Short Trade:
- Take short trade when the price of the instrument breaks down the short breakout level.
- Stoploss: Open of the day
- Target: Consider 1:2 risk reward ratio i.e. target points would be double of SL points
- Square off: If no SL or target hits then exit the trade 15 minutes before the market closes i.e. 3:15 PM.
Max trades per day: Since there can be more number of stocks satisfy the rules on some days we need to restrict maximum number of trades to be taken per day as per risk management. In this back test we will have max 4 stocks for taking trades even though there are more than 4 stocks come into play. Assume on a particular day, there are 6 stocks filtered out and whichever first 4 stocks trigger first (breaks out/breaks down) will be considered for trading on first come first serve basic.
Capital: We are going to assume the total capital as 1 Lakh (1,00,000) for trading max 4 stocks on any given day. We risk only 1% of 1 Lakh on each trade i.e. the risk on each trade is 1,000. On a worst day if all 4 stocks hit stoploss then our max loss would be 4% for that day on total capital.
Back test Period: 01-01-2022 To 24-10-2024 (Approx. 3 years)
Charges: All charges like brokerage, STT, exchange transactions are considered while running back test.
Slippages: This back test does not account any slippages that we encounter in live trading.
Please note we don`t take another trade in the same stock after first trade SL hits.
To keep the back test simple, buffer (delta) value is not considered in this back test. Buffer is some extra value that we consider just above or below the breakout line.
Back test results:
Here is the back test summary report. All the statistics mentioned in below screenshot are self-explanatory.
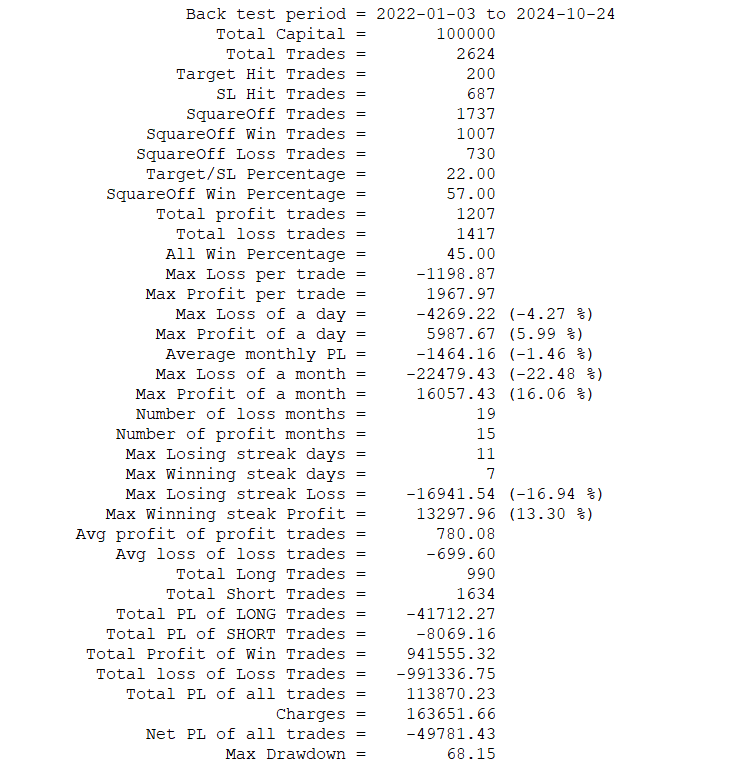
Summary: The overall result is negative 49%. That means if you would have traded this strategy for last 3 years even with discipline you would end up losing 50% capital and experiencing a max drawdown of 68%. If you look at the numbers in the above screenshot closely, actually the strategy gave 100% return in 3 years but the charges are more than profit which turned the strategy net result into -50%. That says charges are crucial part of any trading strategy which cannot be ignored else one would just end up wiping out their entire capital if not cautious.
I am providing you the complete back test report in the form of downloadable excel file at the bottom of the post.
The back test report contains following sheets:
- Trades: All trades with entry, exit, start and end timestamps, pnl, charges, net pnl etc.
- Symbol wise Pnl
- Date wise Pnl
- Date & Symbol wise Pnl
- Month wise Pnl
- Month & Symbol wise Pnl
- Year wise Pnl
- Year & Symbol wise Pnl
- Win Loss Ratio of each stock
- Summary report with important data.
I hope this would be helpful for you guys to do some further analysis.
Download Back test Report:
BackTest_Open-High-Low_2022-01-01_to_2024-10-24.xls


