This article covers the the 2nd part of the ORB strategy with stock selection logic while back testing.
Please read the first part of the discussion here ORB – Part 1.
All the strategy rules are same as part-1. The only thing we are going to have extra here is selecting few stocks based on some criteria to be traded on a particular day instead of trading all the stocks from F&O list.
We are considering first 15 minute for ORB strategy. Please find the rules of the strategy below.
Strategy Rules:
Wait for first 15 minutes after market opens and mark the high and low of the first 15 minute candle.
Long Trade:
- Take long trade when the price of the instrument breaks out the high of the candle
- Stoploss: Low of the candle
- Target: Consider 1:2 risk reward ratio i.e. target points would be double of SL points
- Square off: If no SL or target hits then exit the trade 15 minutes before the market closes i.e. 3:15 PM.
Short Trade:
- Take short trade when the price of the instrument breaks down the low of the candle
- Stoploss: High of the candle
- Target: Consider 1:2 risk reward ratio i.e. target points would be double of SL points
- Square off: If no SL or target hits then exit the trade 15 minutes before the market closes i.e. 3:15 PM.
Stock Selection: After the first 15 minute candles closes at 09:30 AM, select the top 2 gainers and top 2 losers from F&O stocks list. So there will be max 4 stocks to be traded on each day out of 180 stocks. Please note any of the selected stocks breaks high or low of the first 15 minute candle we take the trade. It is not necessary that we only go long in top gainers stock and go short in top losers stock.
Capital: We are going to assume the total capital is 1 Lakh (1,00,000) for trading max 4 stocks on any given day. We risk only 1% of 1 Lakh on each trade i.e. the risk on each trade is 1,000. On a worst day if all 4 stocks hit stoploss then our max loss would be 4% for that day on total capital.
Back test Period: 01-01-2022 To 24-10-2024 (Approx. 3 years)
Charges: All charges like brokerage, STT, exchange transactions are considered while running back test.
Slippages: This back test does not account any slippages that we encounter in live trading.
Please note we don`t take another trade in the same stock after first trade SL hits.
To keep the back test simple, buffer (delta) value is not considered in this back test. Buffer is some extra value that we consider just above or below the breakout line.
Back test results:
Here is the back test summary report. All the statistics mentioned in below screenshot are self-explanatory.
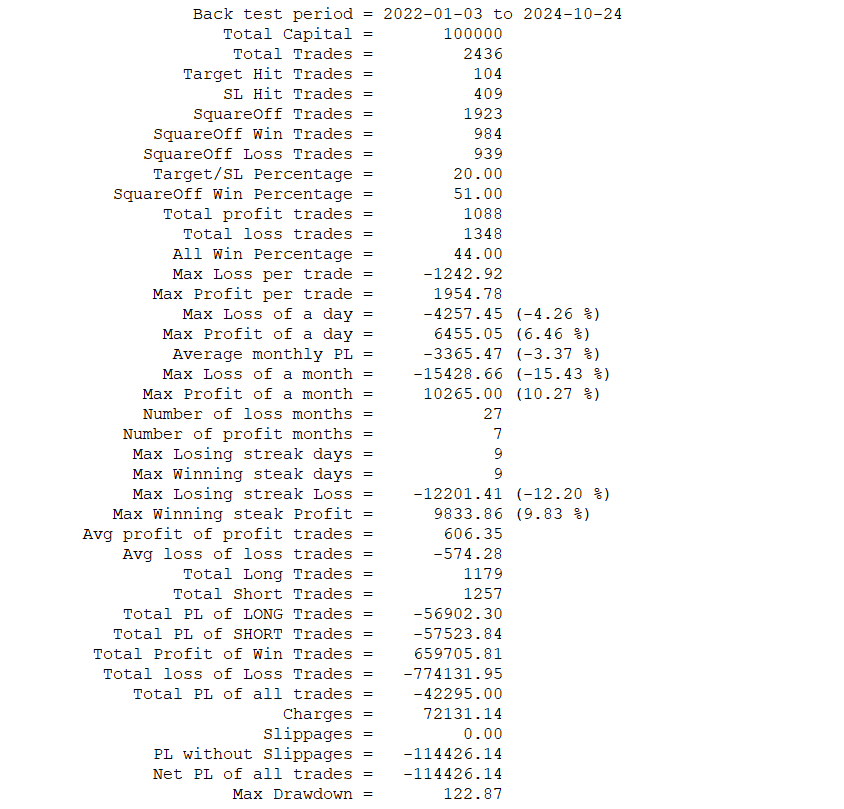
So, the overall strategy outcome is negative. There are more number of loss months than profit months. The drawdown of the strategy hits 100%. That means one could lose complete capital if traded with this strategy during the back test period mentioned above.
Conclusion: Any strategy based on some simple price action or indicator may work during a certain period for 3-4 months. One should not take any call just because the strategy worked for a small time period. Even one year is small for any back test period to be considered. One should at least see the strategy results over 2-3 years time period and take a decision before start trading the strategy with actual capital. Else most of the plain strategies like this can just wipe out your capital even though you are disciplined in your trading.
I am providing you the complete back test report in the form of downloadable excel file at the bottom of the post.
The back test report contains following sheets:
- Trades: All trades with entry, exit, start and end timestamps, pnl, charges, net pnl etc.
- Symbol wise Pnl
- Date wise Pnl
- Date & Symbol wise Pnl
- Month wise Pnl
- Month & Symbol wise Pnl
- Year wise Pnl
- Year & Symbol wise Pnl
- Win Loss Ratio of each stock
- Summary report with important data.
I hope this would be helpful for you guys to do some further analysis.
Download Back test Report:


