In this article, I am going to discuss about VWAP indicator and back testing an intraday strategy based on VWAP.
What is VWAP?
Vwap stands for Volume weighted average price which is a technical indicator that shows the average traded price of a stock or instrument over a period of time. Here is a sample candle stick chart with Vwap indicator.
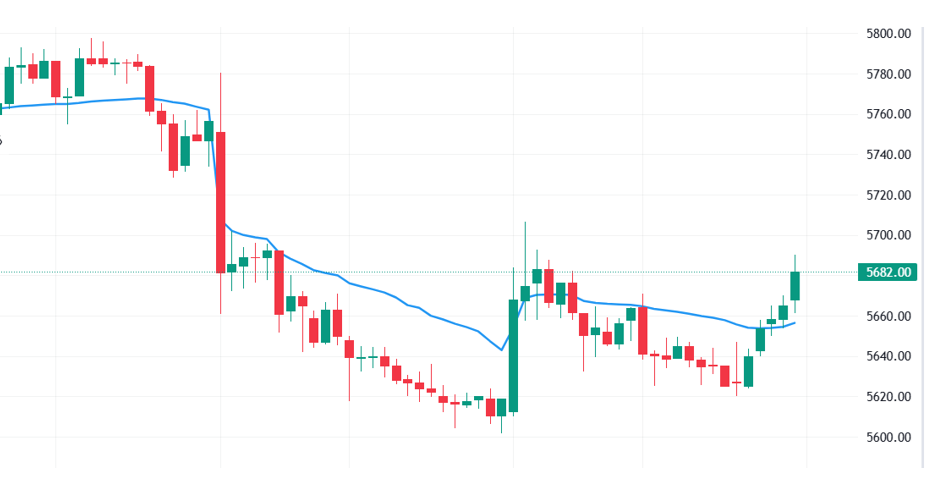
In the above picture a line in blue color indicates the VWAP value after each candle is closed. Generally stock price keeps moving around VWAP line during intraday unless there is a strong continuous one directional move.
In this article, we are considering 15 time frame for trading. Please find the rules of the strategy below.
Strategy Rules:
Timeframe: 15 minute
Ignore first 15 minute candle after market opens to avoid noise in the market.
Long Trade:
- Go long when candle closes above Vwap line with an entry price of candle close
- No stoploss
- No target
- Exit criteria: Exit trade when a candle closes below Vwap line or square off at 3:15 PM (15 minutes before market closes)
- Candle need not to touch Vwap line for considering a trade
Short Trade:
- Go short when candle closes below Vwap line with an entry price of candle close
- No stoploss
- No target
- Exit criteria: Exit trade when a candle closes above Vwap line or square off at 3:15 PM (15 minutes before market closes)
- Candle need not to touch Vwap line for considering a trade
Stock Selection: All Nifty 50 stocks. We are going to run back test on all 50 stocks of Nifty50 index. .
Capital: We are going to allocate 1 Lakh (1,00,000) margin for each stock. Since there is no stoploss in this strategy we cannot calculate the number of quantity based on some percentage risk like 1% of capital. Instead we just calculate the quantity to be traded by dividing the margin by price of the stock. For example ITC is trading at 400. The quantity we take would be 1,00,000 / 400 = 250.
Back test Period: 01-01-2022 To 24-10-2024 (Approx. 3 years)
Charges: All charges like brokerage, STT, exchange transactions are considered while running back test.
Slippages: This back test does not account any slippages that we encounter in live trading.
Please note we don`t take another trade in the same stock after first trade exits.
To keep the back test simple, buffer (delta) value is not considered in this back test. Buffer is some extra value that we consider just above or below the breakout line.
Back test results:
There are very few stocks resulted into profit over the period of 3 years when we ran this test on all Nifty 50 stocks. Please look at the below screenshot for the same.
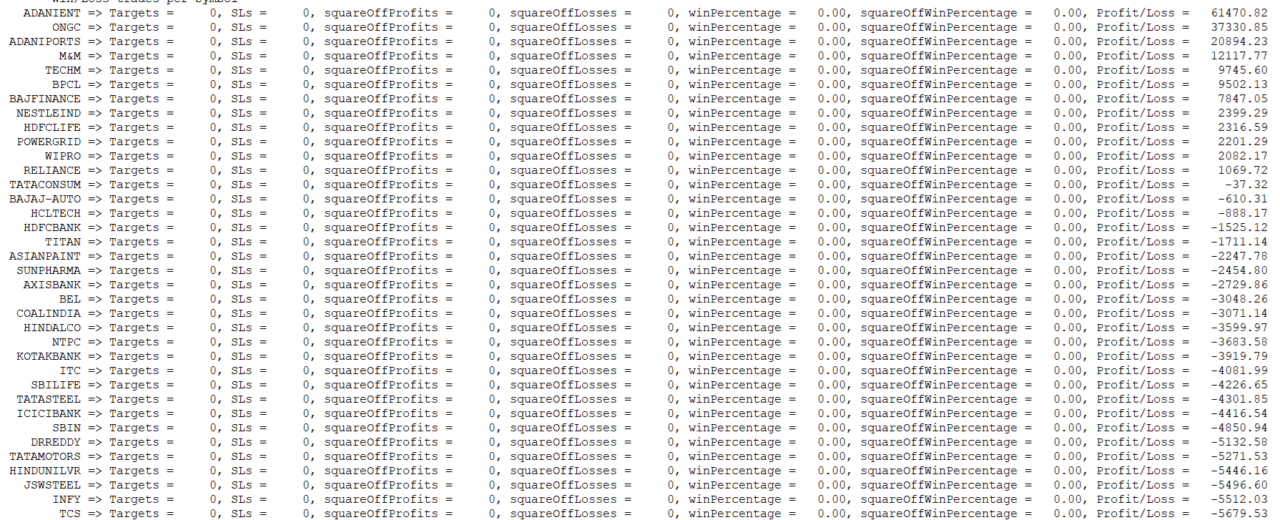
In summary, overall result is negative. Some stocks may perform very well based on this plain Vwap 15 min strategy during a certain period like 3-4 months but when we test on longer time frame of more than 1 year it gives a different picture. From the screenshot above you may think and plan to take trades in the top stocks which gave positive result but you will completely go wrong and lose capital if you do the same. Because when you start trading the same strategy from now onwards, it may happen that going forward some other stocks may perform well and the current winners may become losers in the next few years. So I would strongly suggest one should not blindly take any trades in specific stocks just based on some report.
I am providing you the complete back test report in the form of downloadable excel file at the bottom of the post.
The back test report contains following sheets:
- Trades: All trades with entry, exit, start and end timestamps, pnl, charges, net pnl etc.
- Symbol wise Pnl
- Date wise Pnl
- Date & Symbol wise Pnl
- Month wise Pnl
- Month & Symbol wise Pnl
- Year wise Pnl
- Year & Symbol wise Pnl
- Win Loss Ratio of each stock
- Summary report with important data.
I hope this would be helpful for you guys to do some further analysis.
Download Back test Report:
BackTest_VWAP_V1_2022-01-01_to_2024-10-24.xls


